Table of Contents
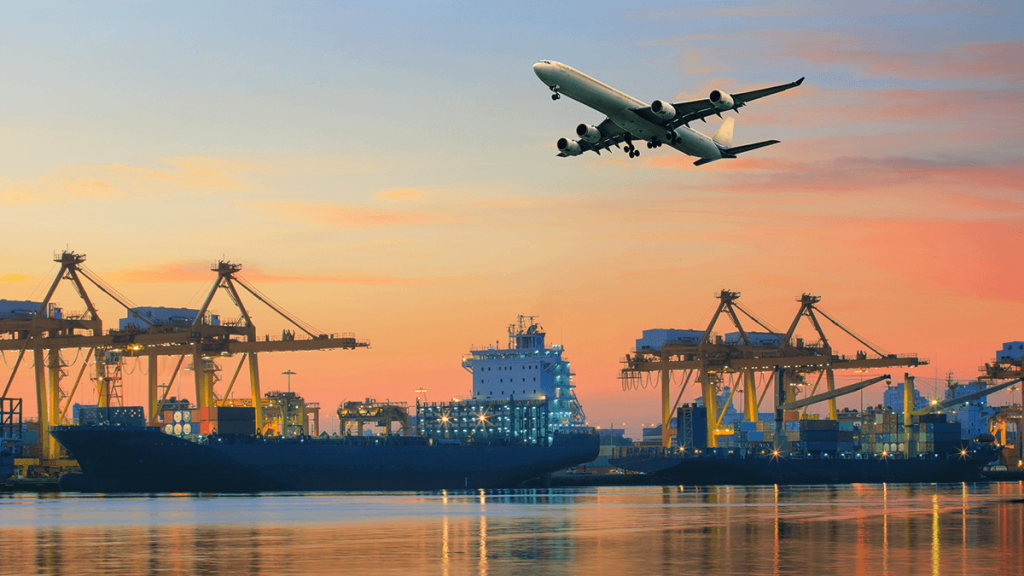
Rising trade between the US and Southeast Asia demands smarter logistics. Understanding US drayage rates 2025 Malaysia helps importers and exporters plan accurate budgets, prevent port delays, and stay compliant. VELOTACTICS LOGISTICS brings expert insight into current rate trends, regulatory shifts, and cost-optimization strategies that streamline container transport across key Malaysian ports.
What Does “US Drayage” Mean for Malaysia Shipments?
Drayage refers to short-distance cargo movement between ports, terminals, and warehouses. In the US–Malaysia trade lane, drayage links ocean freight arriving at Port Klang, Penang, or Johor with inland destinations or bonded facilities.
This stage is critical — inefficiencies in drayage often lead to demurrage, detention, and higher operating costs.
👉 Simplify your port logistics today → Send Inquiry
Why Are US Drayage Rates Rising in 2025?
Several global and regional factors are driving drayage rate changes:
- Port Congestion: Vessel surges post-2024 have stretched yard capacity.
- Fuel Price Fluctuations: Diesel costs and carbon surcharges impact per-container trucking fees.
- Driver Availability: Tight labor conditions in both US and Asian ports raise handling rates.
- Customs Reform in Malaysia: Enhanced inspection measures slow container release.
These factors increase costs by an estimated 8–12% year-on-year, depending on lane and service scope.
Current Average Drayage Rates (2025 Estimates)
| Port Pair | Distance | Avg Cost (USD/Container) | Transit Time | Notes |
|---|---|---|---|---|
| Los Angeles → Port Klang | 8,500 NM | 2,900–3,400 | 24–28 days | West Coast route |
| Houston → Penang | 9,200 NM | 3,200–3,700 | 27–32 days | Gulf route |
| New York → Johor | 9,800 NM | 3,300–3,900 | 29–34 days | East Coast route |
| Seattle → Klang | 8,000 NM | 2,850–3,300 | 23–27 days | Fast Pacific route |
Rates fluctuate with carrier capacity, exchange rates, and bunker adjustment factors (BAF).
What Local Costs Affect Malaysia Drayage Pricing?
| Cost Component | Average Fee (USD) | Description |
|---|---|---|
| Port Handling | 80–150 | Container lift-on/off |
| Customs Clearance | 60–100 | Paperwork and declaration |
| Drayage Trucking | 120–200 | Short-haul delivery |
| Warehouse Storage | 25–50 per day | Temporary storage |
| Weighing & Inspection | 20–40 | Port safety check |
Working with VELOTACTICS LOGISTICS Services ensures transparent pricing with pre-approved local vendors.
👉 Get an all-in-one rate quotation today → Send Inquiry
How Does the US–Malaysia Trade Route Perform in 2025?
Malaysia remains a leading destination for electronics, automotive, and machinery imports from the US.
In 2025, the top-performing ports are Port Klang (Selangor) and Penang Port, supported by advanced terminal automation and bonded warehouse zones.
Transit reliability has improved to 93% on-time delivery, though customs inspection rates increased slightly due to tightened trade rules.
Comparison of Freight Modes to Malaysia
| Mode | Cost (USD/m³) | Transit Time | Ideal Use | Pros | Cons |
|---|---|---|---|---|---|
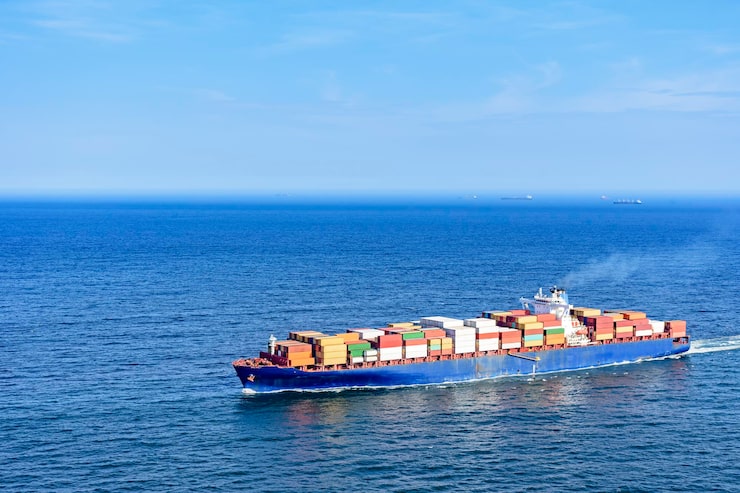
| Sea Freight (FCL) | 50–120 | 22–30 days | Heavy cargo | Economical | Slower |
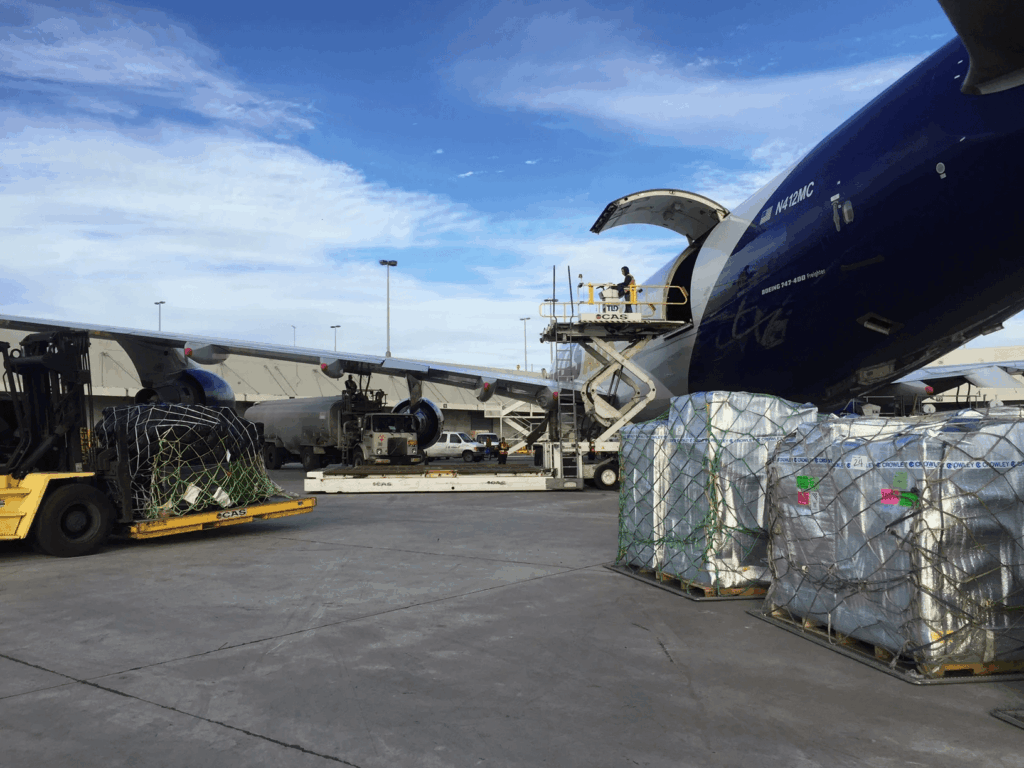
| Air Freight | 450–700 | 3–6 days | Urgent shipments | Fast | Expensive |
| Rail Freight (Asia Link) | 100–150 | 10–14 days | Cross-border | Stable | Limited access |
| Drayage Trucking | 100–250 | 1–3 days | Port handling | Flexible | Port regulations |
Each mode plays a part in multimodal transport, but drayage ensures smooth port-to-warehouse connectivity.
What Regulatory Changes Impact 2025 Drayage Rates?
- Malaysia Customs 2025 Revision: Introduction of real-time cargo scanning increases documentation requirements.
- Carbon Levy Implementation: Malaysia’s Ministry of Transport plans carbon-linked surcharges on diesel trucks.
- Digital Port Integration: Automated slot booking systems reduce idle time but impose cancellation penalties.
- US-Malaysia Trade Agreement Review: Expected updates to HS codes and tariff categories.
These regulatory shifts add short-term complexity but create long-term efficiency through standardization.
How to Calculate Total Drayage Cost (Example)
| Component | Description | Cost (USD) |
|---|---|---|
| Port Drayage | Container move from berth to warehouse | 180 |
| Documentation | Bill of Lading, customs papers | 90 |
| Local Haul (50km) | Port Klang to Shah Alam | 150 |
| Container Return | Empty repositioning | 70 |
| Total | Estimated all-in rate per container | 490 USD |
A typical importer can reduce this cost by 10–15% by optimizing scheduling and consolidating warehouse storage.
Real Case Example: Streamlining Auto Parts Imports
A US automotive exporter delivering 40HQ containers to Malaysia faced delays from inconsistent trucking schedules. VELOTACTICS integrated customs clearance, drayage, and storage under one platform — resulting in:
- 2 days faster customs release,
- 12% reduction in port fees, and
- Stable delivery within 36 hours of vessel arrival.
👉 Let us optimize your next shipment → Send Inquiry
Why Choose VELOTACTICS LOGISTICS?
- 24/7 operation across US and Malaysian ports
- Real-time rate tracking and dynamic cost optimization
- End-to-end solutions: drayage, customs, warehousing, and delivery
- Transparent contracts with no hidden charges
- Sustainability-ready transport solutions
Explore our full logistics service offering for complete trade coverage.
👉 Discover smarter drayage solutions → Send Inquiry

Conclusion:
Understanding US drayage rates 2025 Malaysia enables importers to budget efficiently, ensure compliance, and minimize supply chain risks. With expertise from VELOTACTICS LOGISTICS, your shipments benefit from real-time visibility, regulatory precision, and optimized transport — keeping you ahead in one of Asia’s fastest-growing trade corridors.
Get a Quote
🚀 Get your 2025 drayage rate quote within 24 hours!
Enjoy exclusive pricing for Malaysia-bound shipments and integrated customs coordination.
Trusted by 5,000+ importers worldwide — secure your booking today.
FAQ
Rates range between USD 2,800–3,900 per container depending on route and port.
Port Klang offers the highest capacity and fastest customs turnaround.
Fuel prices, port congestion, customs procedures, and distance are key factors.
Yes, VELOTACTICS offers integrated drayage, customs, and warehousing services.
Predictive analytics and digital scheduling minimize idle time and fuel costs.
Yes, electric and hybrid drayage fleets are expanding under 2025 port sustainability policies.