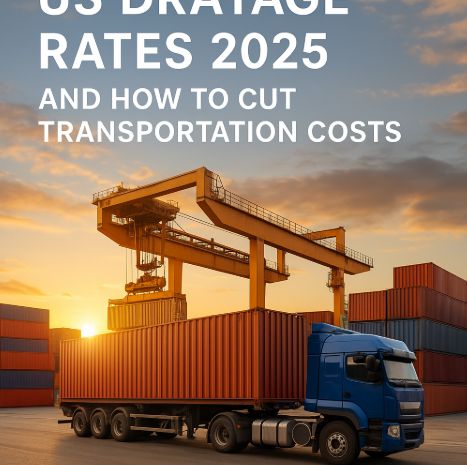
The logistics industry continues to evolve rapidly, and US drayage rates in 2025 are no exception. With increasing port congestion, fuel price fluctuations, and stricter environmental policies, drayage costs are rising — affecting importers, exporters, and freight brokers nationwide. However, with proper planning and the right logistics partner, businesses can reduce expenses and improve port-to-door delivery efficiency. This guide explores the latest rate trends, key cost drivers, and smart ways to control your short-haul container transportation costs.

What Are US Drayage Rates?
Drayage refers to the short-distance transport of containers between ports, rail terminals, and warehouses. US drayage rates include multiple cost components: trucking, chassis rental, terminal handling, fuel surcharges, and accessorial fees.
While it’s often a small part of total freight spend, drayage directly impacts the speed and reliability of supply chain operations.
What Factors Influence Drayage Rates in 2025?
Several variables shape US drayage rates in 2025, including economic, regulatory, and operational conditions. The following are the key cost drivers importers should monitor:
- Fuel Prices – Diesel and alternative fuel costs heavily influence short-haul pricing.
- Driver Shortage – Limited labor availability increases hourly rates and overtime costs.
- Port Congestion – Waiting times and appointment delays cause additional charges.
- Equipment Costs – Chassis shortages or premium rentals push daily rates higher.
- Environmental Regulations – Ports implementing clean air policies raise compliance costs.
- Distance and Location – Rates vary depending on port-city routes and mileage brackets.
Therefore, predicting and controlling these factors helps reduce logistics expenses over the long term.
Average US Drayage Rates 2025 by Region
| Port / Region | Typical Route Distance | Estimated 2025 Rate (40ft Container) | Notes |
|---|---|---|---|
| Los Angeles / Long Beach | 25–75 miles | $380–$480 | High congestion; EV truck surcharges possible |
| Houston | 50–150 miles | $320–$420 | Steady fuel costs; strong driver availability |
| Savannah | 25–100 miles | $300–$400 | Efficient operations; lower accessorials |
| New York / Newark | 15–50 miles | $350–$450 | Toll and congestion zone surcharges |
| Seattle / Tacoma | 20–60 miles | $340–$460 | Weather and port dwell time variability |
These are indicative averages. Actual costs depend on factors such as pickup urgency, yard storage time, and chassis type.
Why Are Drayage Costs Increasing in 2025?
Compared to pre-2020 levels, drayage rates in 2025 remain approximately 15–25% higher due to the following reasons:
- Diesel prices remain volatile despite the rise of electric trucks.
- Infrastructure fees are increasing to support port modernization projects.
- Sustainability initiatives, such as zero-emission drayage programs, add compliance expenses.
- Insurance premiums for trucking fleets have grown due to higher liability claims.
Nevertheless, technological innovation and improved scheduling systems are helping offset some of these costs.
How Drayage Impacts Total Freight Costs
Although drayage typically covers short distances, it can account for 10–15% of total freight expenses when poorly managed. Delayed container pickups lead to:
- Port storage and demurrage charges
- Missed rail connections
- Longer delivery lead times
- Idle labor at warehouses
Therefore, investing in efficient drayage coordination and visibility systems can produce measurable savings across the supply chain.
Comparing Drayage Costs vs. Other Transport Modes
| Mode | Cost per Mile (Average) | Transit Time | Key Advantage |
|---|---|---|---|
| Drayage (Short-Haul) | $2.50–$4.00 | 1 day | Immediate port-to-warehouse transfer |
| Intermodal Rail | $1.20–$1.80 | 3–7 days | Lower long-haul costs, greener option |
| Full Truckload (FTL) | $2.60–$3.20 | 2–4 days | Door-to-door direct delivery |
| LTL Freight | $3.00–$4.50 | 4–6 days | Shared cost for small shipments |
As shown, drayage may seem expensive per mile, but it provides unmatched speed and flexibility for containerized cargo leaving ports.

How to Reduce US Drayage Rates in 2025
Lowering drayage costs requires a mix of strategic planning, technology adoption, and partnership optimization.
Here are effective methods to achieve real savings:
1. Optimize Pickup Timing
Coordinate terminal appointments and customs release schedules to minimize detention and demurrage.
2. Consolidate Deliveries
Combine shipments bound for similar locations to reduce the number of drayage moves.
3. Use Smart Route Planning
Leverage AI-powered dispatch tools to identify the fastest and most fuel-efficient routes.
4. Choose Asset-Based Carriers
They often provide better control over equipment, reducing rental or transfer fees.
5. Adopt Electric or LNG Fleets
Some providers offer discounted rates for green shipments as ports incentivize low-emission operations.
6. Work With an Integrated Logistics Partner
A single provider managing drayage, intermodal, and warehousing reduces coordination errors and costs.
How Velotactlcs Logistics Adds Value to Drayage Operations
At Velotactlcs Logistics, we understand that drayage is more than short-distance trucking — it’s the foundation of supply chain efficiency.
Our solutions include:
- Real-time visibility platforms that track every container move.
- Dynamic dispatch systems that match trucks and routes in seconds.
- 24/7 port coordination teams for faster gate turn times.
- Nationwide drayage coverage, including Los Angeles, Houston, Savannah, and Newark.
By leveraging data analytics and automation, Velotactlcs Logistics helps clients lower drayage-related costs while maintaining full schedule control.
What Role Does Technology Play in Controlling Drayage Costs?
Technology is the main driver of cost efficiency in US drayage logistics. Modern systems improve communication and reduce idle time.
Examples include:
- GPS fleet monitoring for real-time updates.
- Electronic gate-in/out systems to shorten port wait times.
- AI-based rate forecasting to anticipate fuel or seasonal cost fluctuations.
- EDI integration with customer TMS for seamless order visibility.
Therefore, adopting digital logistics solutions provides a significant return on investment, especially for high-volume shippers.
What Are the Hidden Costs in Drayage?
Many companies underestimate hidden drayage expenses that accumulate over time.
Watch out for:
- Chassis per diem fees after free days expire.
- Container demurrage charges due to late pickup.
- Terminal storage fees when appointments are missed.
- Empty repositioning costs for unbalanced lanes.
By proactively managing these aspects, importers can save thousands of dollars per year on port operations.
Predicted Trends for US Drayage Rates in 2025
The outlook for drayage rates in 2025 shows moderate increases in most regions due to inflation and environmental policies. However, digitalization and alternative energy adoption are expected to stabilize prices by late 2025.
Key trends include:
- Growth of electric drayage fleets near major ports.
- Wider adoption of automated scheduling platforms.
- Expansion of off-dock container yards for storage optimization.
- Dynamic pricing models replacing fixed rate contracts.
- Greater collaboration between shippers and 3PLs for cost sharing.
Hence, the market is evolving toward greater transparency and flexibility in drayage pricing.
How Economic Factors Affect Drayage Pricing
The 2025 US economy continues to experience fluctuations in fuel, labor, and infrastructure costs. The following table summarizes economic influences:
| Cost Driver | 2024–2025 Trend | Impact on Drayage |
|---|---|---|
| Diesel Prices | Moderate increase | Higher per-mile rates |
| Labor Costs | Slight rise | Increased driver pay scales |
| Infrastructure Fees | Expanding at ports | Added surcharges for upgrades |
| Green Fleet Investment | Accelerating | Temporary price hikes, long-term savings |
While these challenges raise short-term costs, efficiency gains from automation and sustainable fleets will balance pricing by 2026.
How Shippers Can Prepare for 2025 Rate Changes
To adapt to changing drayage costs in 2025, companies should:
- Reassess annual logistics budgets early.
- Partner with providers offering transparent, flexible contracts.
- Use predictive analytics to monitor fuel and chassis rate trends.
- Diversify port choices to avoid congestion-related surcharges.
Preparation ensures resilience against cost volatility and supply chain disruptions.
Conclusion
Understanding US drayage rates in 2025 is essential for every business moving containers through American ports. From fuel surcharges to terminal fees, each component influences overall logistics costs. By leveraging smart technology, efficient scheduling, and trusted partners like Velotactlcs Logistics, companies can navigate rate increases and sustain competitive advantage. With the right strategy, your port operations can become faster, greener, and far more cost-effective.
Need a quote?
Ready to get started? Contact us now to request a free shipping quote.
Frequently Asked Questions (FAQ)
Rates range from $300 to $480 per container depending on port location, distance, and congestion conditions.
Yes, modest increases are expected through late 2025 due to rising fuel and compliance costs.
By scheduling pickups efficiently, consolidating loads, and partnering with technology-driven logistics providers.
Fuel price volatility and port congestion are the two primary factors impacting rate surges.
Over time, yes. Electric or LNG fleets reduce fuel and maintenance expenses despite higher upfront costs.