Table of Contents
The U.S. import market continues to evolve rapidly, influenced by global trade shifts, logistics costs, and supply chain strategies. Understanding US import statistics by country helps importers, freight forwarders, and logistics planners forecast demand and optimize sourcing. As global trade rebounds post-pandemic, staying informed through accurate import data has never been more critical. Learn how these trends impact your business and how VELOTACTICS LOGISTICS supports smarter import strategies.
What Are the Latest US Import Statistics by Country in 2025?
In 2025, the U.S. continues to import heavily from Asia, led by China, followed by Mexico, Canada, Japan, and Germany. The total import value exceeded $3.5 trillion, a 4% increase from 2024.
| Country | 2025 Import Value (USD Billion) | Share of Total Imports | Key Products |
|---|---|---|---|
| China | 550 | 15.7% | Electronics, machinery, textiles |
| Mexico | 440 | 12.6% | Auto parts, machinery, food |
| Canada | 410 | 11.8% | Energy, metals, chemicals |
| Japan | 210 | 6.1% | Vehicles, precision tools |
| Germany | 180 | 5.2% | Machinery, medical devices |
| South Korea | 140 | 4.0% | Semiconductors, chemicals |
| Vietnam | 130 | 3.8% | Apparel, electronics |
| India | 120 | 3.5% | Pharmaceuticals, machinery |
| United Kingdom | 90 | 2.6% | Luxury goods, beverages |
These figures demonstrate the shifting balance between traditional trading partners and emerging economies like Vietnam and India.
👉 Tip: Understanding trade shares helps optimize sourcing and reduce risk from tariffs or geopolitical changes.
👉 Send Inquiry →
Why Are Import Statistics Important for US Businesses?
Import data offers insights into cost structures, logistics routes, and competitive sourcing. For example, U.S. importers sourcing machinery from China might compare it against options in Mexico to reduce tariffs and shipping time.
Import statistics also guide freight forwarders when planning routes, warehousing, and customs procedures. Partnering with logistics experts like VELOTACTICS LOGISTICS Services ensures compliance and efficiency.

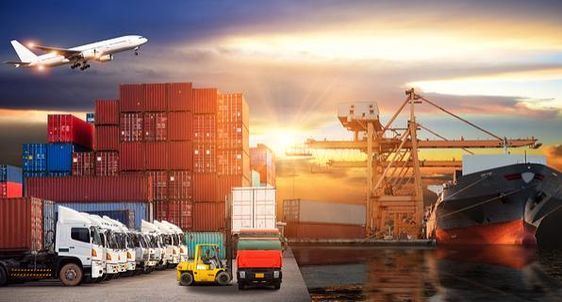
Which Shipping Methods Are Most Used for US Imports?
| Shipping Mode | Average Cost per kg | Average Transit Time | Best For | Key Advantage |
|---|---|---|---|---|
| Sea Freight | $0.6 – $2.5 | 20–35 days | Bulk goods | Cost-effective |
| Air Freight | $4.5 – $8.0 | 3–7 days | Urgent cargo | Fast and secure |
| Express Service | $6.5 – $10 | 1–5 days | Small packages | Door-to-door convenience |
Sea freight remains the most popular due to its affordability, while air freight is preferred for time-sensitive or high-value goods. Express shipping continues to grow, especially for eCommerce imports from China.
Learn more about Air Freight and Sea Freight solutions tailored to your cargo needs.
👉 Send Inquiry →
How Are Tariffs and Customs Impacting 2025 Imports?
In 2025, U.S. tariffs remain selective, focusing on industries like solar panels, EV batteries, and certain steel products. Compliance requires precise documentation and correct Harmonized System (HS) codes.
| Document Type | Purpose | Required By |
|---|---|---|
| Commercial Invoice | Declares goods value | Customs Authority |
| Bill of Lading | Proof of shipment | Carrier & Importer |
| Packing List | Identifies contents | Customs Broker |
| Importer Security Filing (ISF) | Advance cargo details | U.S. CBP |
| Certificate of Origin | Verifies product origin | Trade Agreements |
Working with professional Customs Brokerage ensures error-free clearance and prevents costly delays.
What Are the Key Import Trends for 2025?
- Nearshoring from Mexico and Canada – U.S. importers diversify away from Asia to reduce lead times.
- Digital Customs Platforms – AI-driven clearance cuts documentation errors by 40%.
- Green Supply Chains – Sustainability becomes a top priority for shipping partners.
- Freight Rate Stabilization – Ocean freight rates are projected to decline 8–10% in 2025.
- Faster Door-to-Door Models – Integrated Door to Door shipping shortens last-mile transit.
These trends shape how importers choose suppliers and logistics partners.
👉 For tailored trade insights and lower shipping costs, Send Inquiry →
Which Countries Have the Fastest Growing Trade With the US?
Emerging economies are gaining ground, offering competitive production costs and flexible supply chains.
| Country | Growth Rate (2025 YoY) | Major Exports to US |
|---|---|---|
| Vietnam | +11.5% | Apparel, furniture, electronics |
| India | +9.8% | Machinery, pharmaceuticals |
| Indonesia | +7.2% | Textiles, rubber, paper |
| Thailand | +6.8% | Auto parts, electronics |
| Turkey | +6.5% | Steel, household goods |
These nations are becoming key alternatives for importers shifting from China.
How to Reduce Import Costs Using Data Insights
Data helps importers choose smarter routes, avoid high-tariff suppliers, and optimize packaging. Working with professionals like VELOTACTICS LOGISTICS Import Service allows for consolidated shipping and cost sharing.
Cost Optimization Strategies:
- Use mixed-container (LCL) shipping for low-volume imports.
- Store inventory strategically through Warehouse networks near major ports.
- Insure valuable shipments using Cargo Insurance.
By analyzing trade data, you can reduce expenses by 12–18% annually.
👉 Send Inquiry →
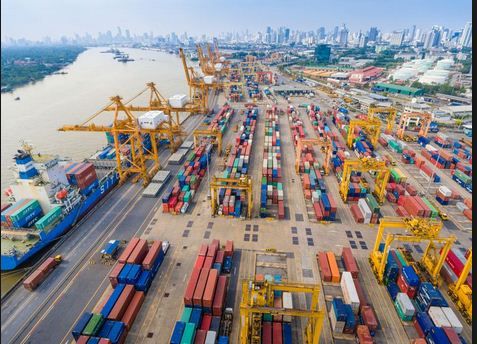
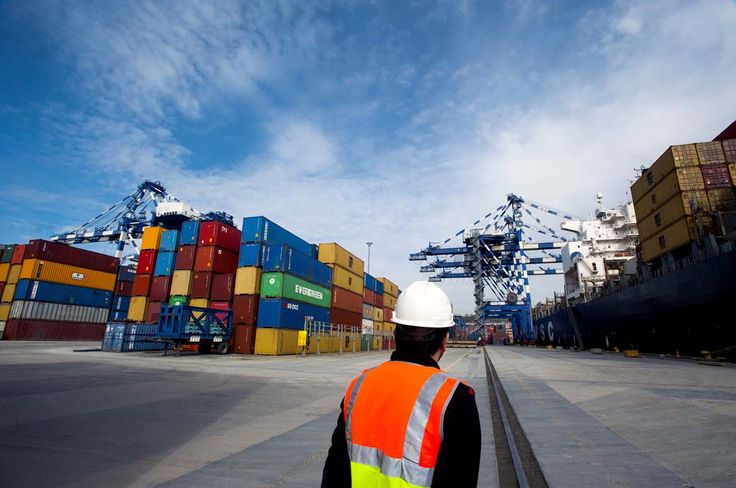
What Are the Top Ports for US Imports in 2025?
| Port | Location | Annual Volume (Million TEUs) | Key Goods |
|---|---|---|---|
| Los Angeles | California | 9.2 | Electronics, textiles |
| Long Beach | California | 8.5 | Consumer goods |
| New York/New Jersey | East Coast | 7.8 | Machinery, vehicles |
| Savannah | Georgia | 5.6 | Industrial materials |
| Houston | Texas | 4.9 | Energy, chemicals |
Efficient port logistics and reliable shipping schedules help minimize delays and demurrage costs.
What Is the Future of US Imports Beyond 2025?
Experts predict moderate growth driven by automation, digital trade systems, and stronger regional partnerships. Advanced analytics will allow importers to predict demand, reducing overstocking and improving delivery schedules.
Companies integrating digital customs tools and transparent shipping visibility will maintain a strong competitive edge.

Conclusion:
The US import statistics by country reveal vital insights into trade dynamics, cost management, and logistics planning for 2025. By studying key partners, tariffs, and freight trends, importers can make informed sourcing and shipping decisions. Partnering with VELOTACTICS LOGISTICS ensures smarter, compliant, and cost-effective global operations.
Get a Quote
Get your personalized import solution today. Our experts analyze your trade routes, tariffs, and delivery timelines to offer the best shipping strategy. 🚀
Get a quote within 24 hours — trusted by 5,000+ importers worldwide.
FAQ
China remains the top exporter, contributing about 15% of total U.S. imports, mainly electronics, machinery, and consumer goods.
Public databases like USITC and Census Bureau provide import data by HS code and country. Logistics companies also offer summarized dashboards.
Automotive parts, renewable energy equipment, and pharmaceuticals show double-digit growth.
Some tariffs remain on strategic sectors, while trade agreements with Mexico, Canada, and the EU are reducing rates for key goods.
Submit accurate documentation early, partner with a licensed customs broker, and track shipments digitally for pre-clearance.
Sea freight offers the best cost savings for bulk cargo, while air freight suits urgent or high-value shipments needing fast turnaround.